Applications
Fitting
Plant structure fitting - Damped growth
Damped growth fitting
-
Let us fit the growth development process parameters for continuous growth in a more complex case,
with damped growth on branches, also showing mortality.
Such is the case of the coffee tree.
The architecture of the coffee is characterized by two different physiological ages, for the main axis and the branches, respectively.
The trunk and the branches show different development.
The main axis shows a classic continuous indeterminate Bernoulli development process (b=0.92 on the species studied here).
On the other hand, branch growth is determinate, stopping gradually over time.
In order to retrieve the development process properties, only the distribution of living branches must be considered.
On these, branches development slows down depending on the number of growth cycles.
Phytomer living branches distributions show a quadratic relation between the variance and the expected value.
This property relates to damped growth, in which the Bernoulli parameter b changes according to the growth cycle as follows:
b(i) = bi
Therefore, at a given growth cycle K, the expected value XK and the variance VK are respectively
The fitting of parameter b can thus be performed from a dataset of different growth stages.
Example. Coffee tree branches
Following expected values and variance relations at several growth stages
This example involves 1,416 coffee tree branches (Clones of Coffea robusta).
-
If the development process is a Bernoulli process, then the mean and variance are proportional to the
Bernoulli parameter (V = (1 - b). X).
The expected value increase is of course obvious when considering growth, and thus several growth stages are necessary to build a significant data set.
In this example, 6 growth steps where studied on population of 1,416 branches.
Their respective expected values and variances are given below:
| Expected value (X) | 0.0, | 5.47, | 11.25, | 15.69, | 19.84, | 21.78, | 23.81 |
| Variance (V) | 0.0, | 0.38, | 1.99, | 4.02, | 5.88, | 8.69, | 9.22 |
A least square regression (see http://statpages.org/nonlin.html ) leads to :
V = 0.015826 . (X2 + X) = (1 - b2) (X2 + X) (r=0.9857)
and gives thus b = 0.9688

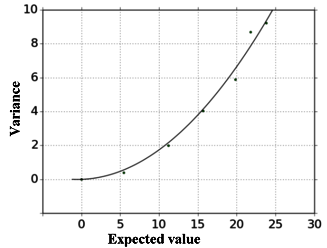
Variance and expected value relations (Graph P. de Reffye, CIRAD)
-
The points are the data observed at 6 growth stages.
The curve stands for the fitted equation : V = 0.015826 . (X2 + X)
The phytomer number distribution fitted satisfactorily to a binomial law, but resulted from a complex Bernoulli process, with a non-constant parameter.
The corresponding adjusted b parameter is an average value.
