GreenLab Course
Production-Expansion
Density effect (reminder).
Density
Plant density greatly affects overall biomass production due to competition for light, water, and nutrient resources.
In controlled environments (i.e. in green houses), competition mainly involves the light resource.
At low density, or early growing stages, competition for light between plants is reduced.
As plants grow, the canopy closes, reducing the light resource, until reaching complete canopy cover.
At this point, experiments have shown that biomass production reaches a stable maximum.
As a consequence, the overall change in biomass production is therefore different if considered at plant level or at crop level.
Density effect at plant level
At the canopy closure stage, biomass production is stable.
The weight of each individual biomass increase is therefore proportional to the number of plants per square metre, i.e. proportional to the inverse of the density.
Considering overall individual production, this proportionality remains true if the cover happens at the early growth stages.

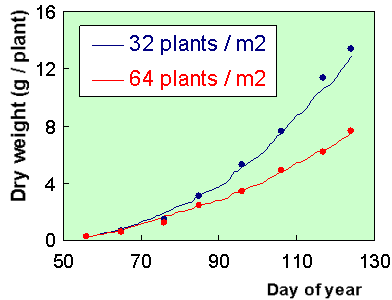
Chrysanthemum biomass production at plant level at two densities (Graph E. Heuvelink, WAGENINGEN UNIVERSITY)
- This experiment, carried out at Wageningen University on Chrysanthemum, compares biomass
production at plant level at densities of 32 plants per m2 (in blue)
and 64 plants per m2 (in red).
The graph shows that production was similar for both cases up to 60 days.
On that date, the canopy closed at high density, leading to lower individual production.
At the mature stage, the individual average weight of the 32 p.m2 crop was nearly double the individual average weight of the 64 p.m2 crop.
Density effect at crop level
When considering overall biomass production per area, density has no effect if the canopy is closed at very early stages.
However, it does not mean that the fruit is the same: the plant usually adjusts its structure to optimize its production. In general, at early growth stages, canopy cover is not reached, leading to a shift in production profiles when comparing different density experiments.

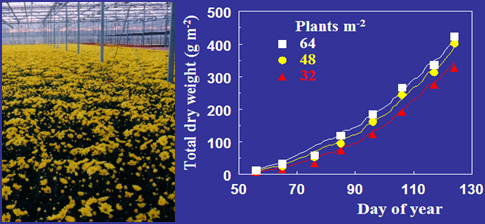
Chrysanthemum crop biomass production at three densities (Photo and Graph E. Heuvelink, WAGENINGEN UNIVERSITY)
- In this case, the same experiments carried out at Wageningen University on Chrysanthemum compared
biomass production at crop level for 32, 48 and 64 plants per m2.
The production curves, expressed in g per m2 are similar, staggered by a period corresponding to the different canopy closing dates.
